Greetings IGGPPC Nation,
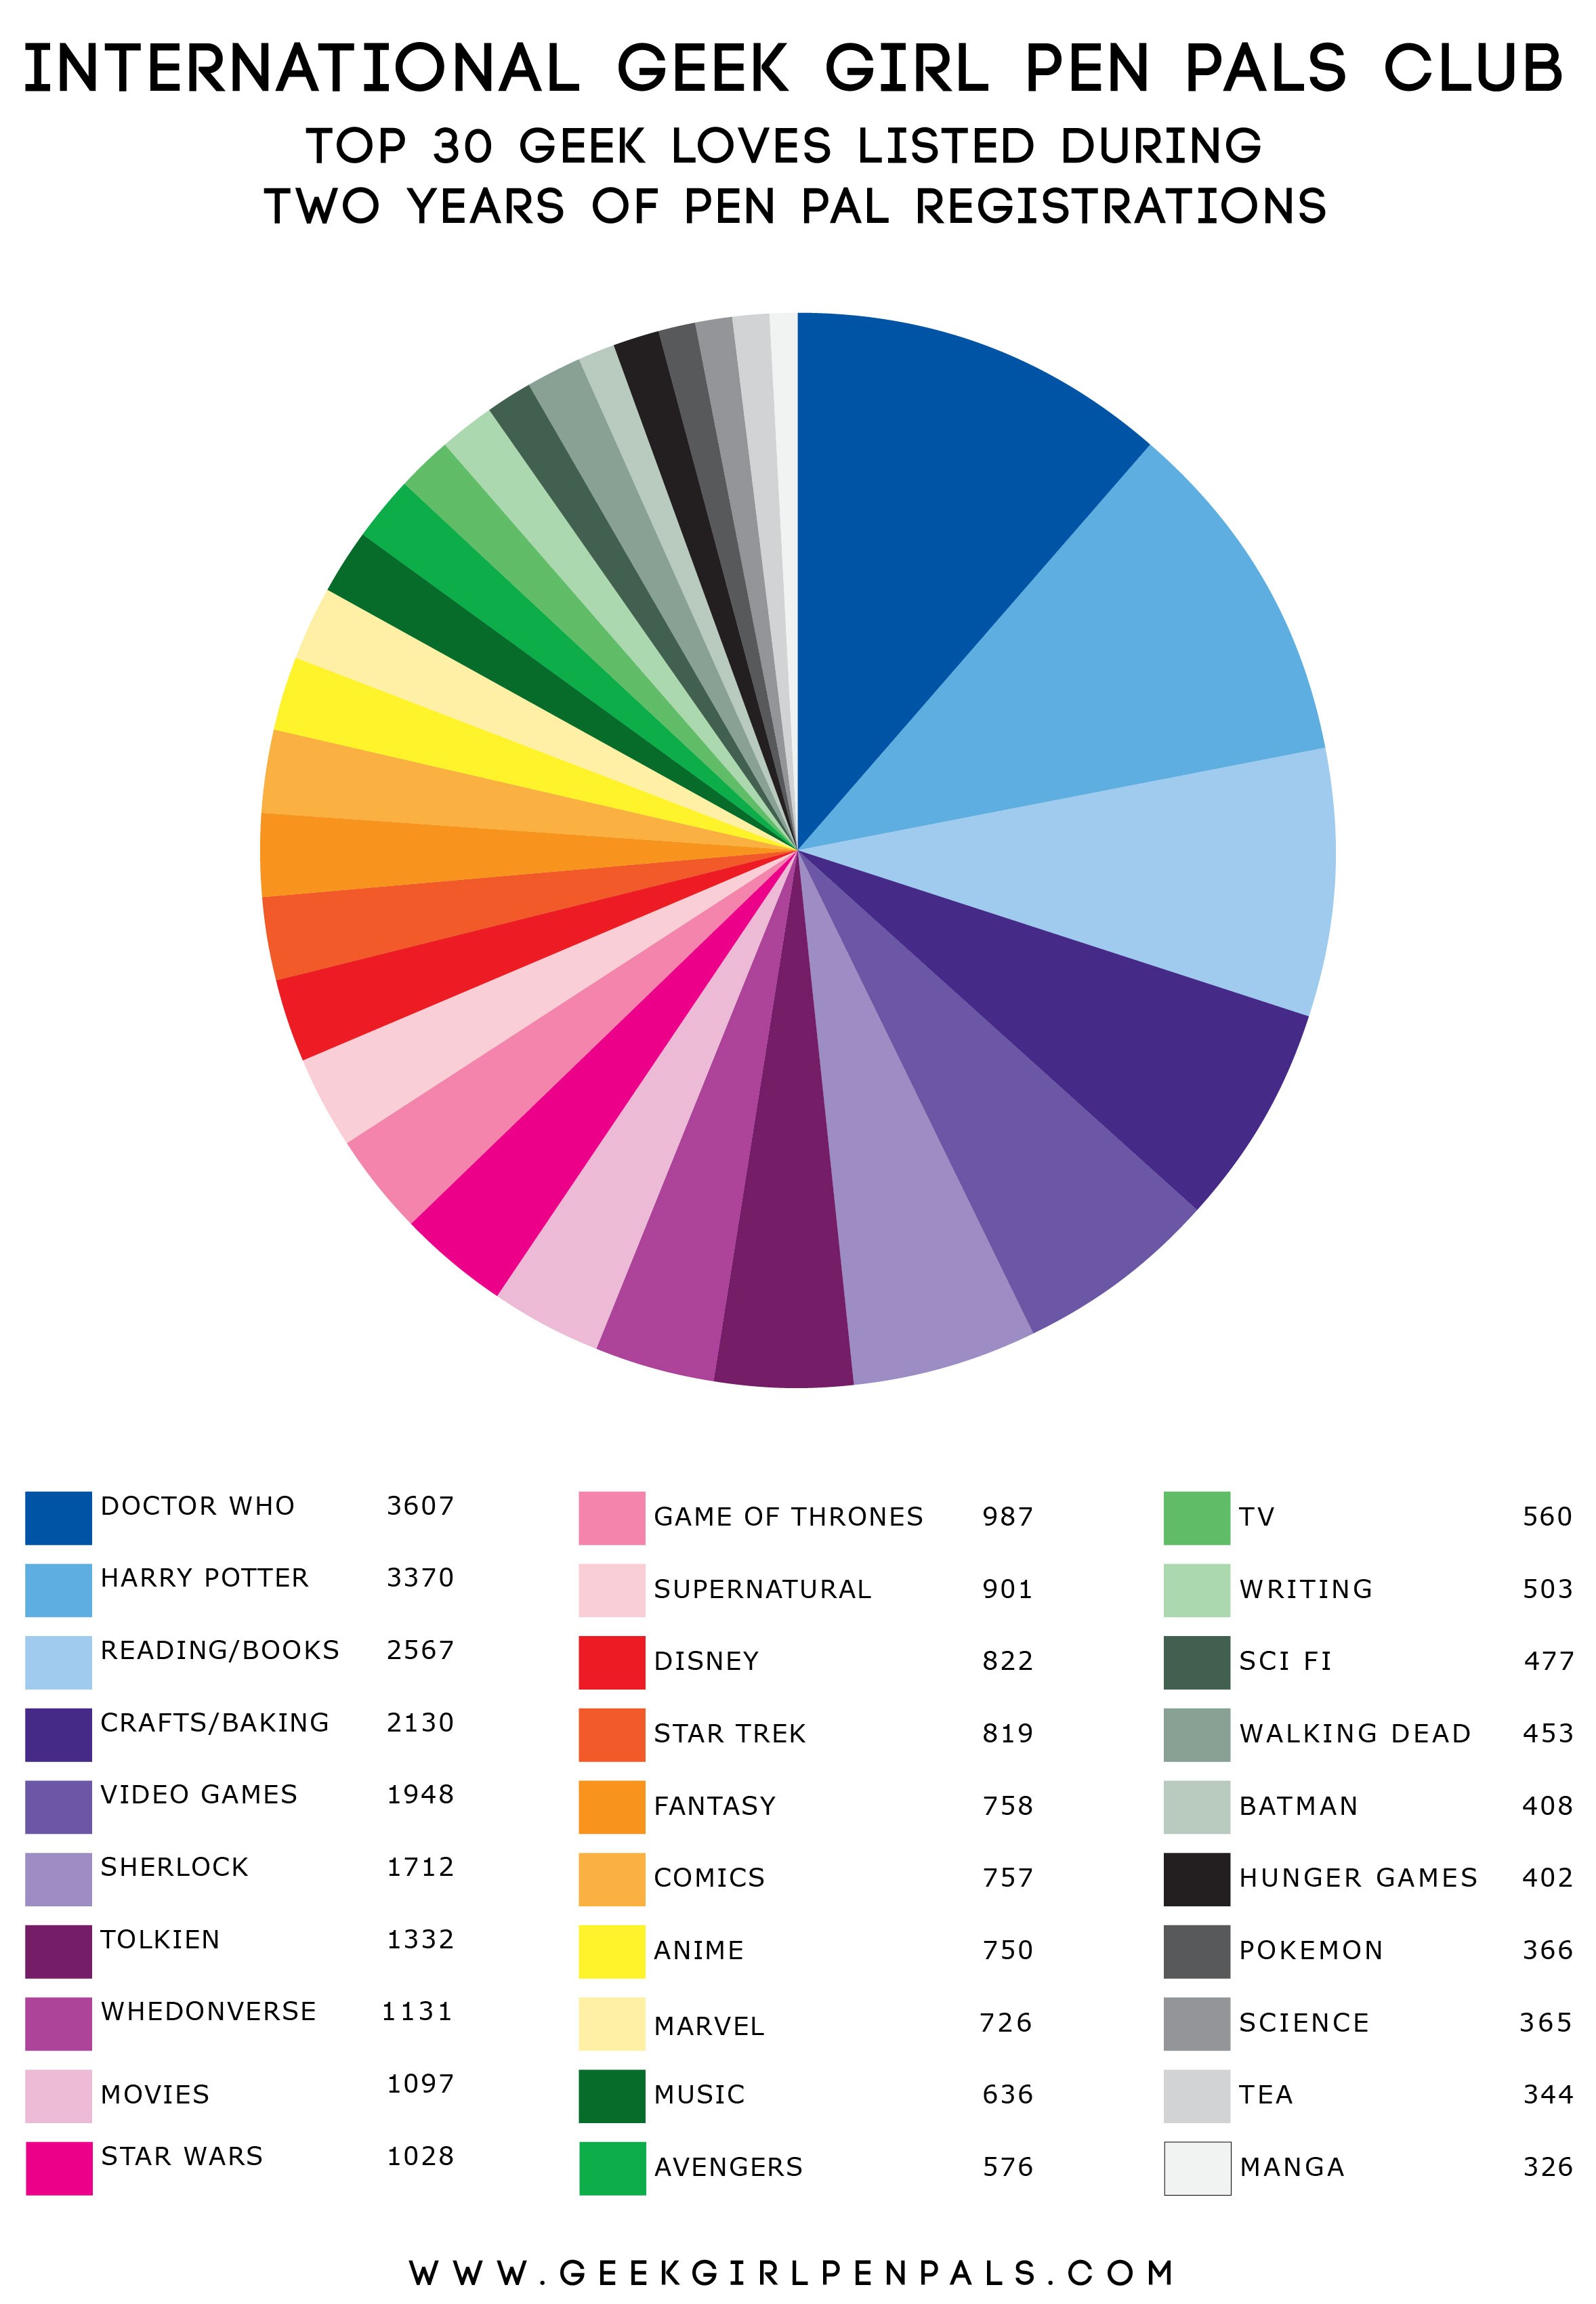
As it is now tradition, I am here to divulge some of the statistics from the last two years of IGGPPC! Last year y’all went wild for my pie charts so this year I had to do one better so this year we have an interactive infographic – just roll over the sections to see the numbers!
As promised below is a break down of how certain geek love categories are made up of a few different loves to make a combined total.
Video Games: Video Games, Mass Effect, Portal, Warcraft, Skyrim, Nintendo, Xbox, Playstation, Animal Crossing, Dragon Age, Zelda, Mario, Minecraft
Reading + Books: reading, books
Movies: Movies, Film
Lord of the Rings + Hobbit: Lord of the Rings, LOTR, Hobbit, Tolkein
Crafts + Baking: Crafts, Knit, Sew, Crochet, Baking
Whedonverse: Buffy the Vampire Slayer, BTVS, Firefly, Whedon
Avengers: Avengers, Captain America, Thor, Hulk, Iron Man, Black Widow, Hawkeye, Shield, Agent Carter
Game of Thrones: Game of Thrones, GoT, A Song Of Ice And Fire, ASOIAF
Disney: Disney, Pixar
Walking Dead: Walking Dead, Zombies
Sci Fi: Science Fiction, Sci-Fi, Sci Fi, SCIFI
Nerdfighter: Nerdfighters, DFTBA
And because I know some people will miss it, here is the geek loves pie chart on its own!
Are there any statistics you would want to see that aren’t here? Want to know how many people have listed your favourite geek love? Feeling shocked that something is missing from the top loves? Share your thoughts below in the comments!

Stats galore! how cool 🙂
thanks! I enjoyed collating it!
I cannot handle all the numbers! Oh, my goodness! I am so happy that this site is as widespread as it is! I’m not crying, you’re crying.
we are both crying! <3
Looooooove seeing some exploratory data analysis! Nice infographics 😀
thanks! infrogr.am is a fantastic tool to use!
[…] Geek Girl Pen Pals (IGGPPC) turns 2 this month! Here are some numbers about the organization and its success! Want to know how many Iggles there are in Iceland and New […]
These statistics, graphically explained, are a work of art and bring tears to my eyes. Infinite thanks for putting this together!!
Aww bless you, you’re welcome!
[…] our birthday month draws to a close we have one final tidbit to share with you. You’ve had all the stats and 2 years of design, now it is time for a history lesson as we look back on the key moments of […]
What about Homestuck/webcomics?